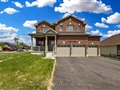
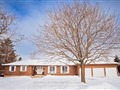
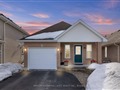
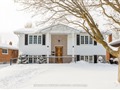
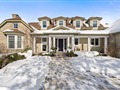
99 Alcorn Dr
$943,648
Comparative Market Analysis
Jun 30, 2025
NOT AN ACTIVE LISTING
Historical Performance
| Period | $ Change | % Change |
| 1 Day | +$63 | +0.007% |
| 7 Days | -$396 | -0.042% |
| 30 Days | -$2,439 | -0.258% |
| 3 Months | -$1,641 | -0.174% |
| 6 Months | +$21.6k | +2.35% |
| 1 Year | -$31.4k | -3.22% |
| 3 Years | +$197k | +26.4% |
| 5 Years | +$277k | +41.6% |
| 10 Years | +$504k | +115% |
List My Property
Real Estate Statistics
Financing Solutions
Browsing History
54 Alcorn Dr, Kawartha Lakes
1 second ago
87 Eglington St, Kawartha Lakes
3 seconds ago
AS SEEN ON

Are You a Licensed Real Estate Agent or Broker?