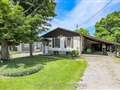
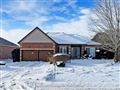
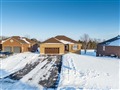
84 Nonquon Dr
$906,526
Comparative Market Analysis
Jul 2, 2025
NOT AN ACTIVE LISTING
Historical Performance
| Period | $ Change | % Change |
| 1 Day | +$60 | +0.007% |
| 7 Days | +$32 | +0.004% |
| 30 Days | -$282 | -0.031% |
| 3 Months | +$5,464 | +0.606% |
| 6 Months | +$36.4k | +4.18% |
| 1 Year | +$10.3k | +1.15% |
| 3 Years | +$328k | +56.7% |
| 5 Years | +$404k | +80.4% |
| 10 Years | +$551k | +155% |
List My Property
Real Estate Statistics
Financing Solutions
AS SEEN ON


Are You a Licensed Real Estate Agent or Broker?