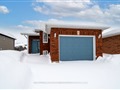
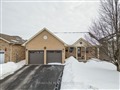
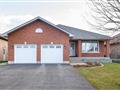
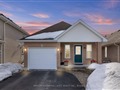
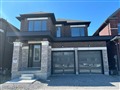
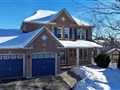
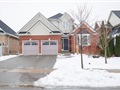
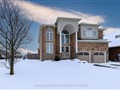
79 Mcgibbon Blvd
$583,288
Comparative Market Analysis
Jun 8, 2025
NOT AN ACTIVE LISTING
Historical Performance
| Period | $ Change | % Change |
| 1 Day | +$39 | +0.007% |
| 7 Days | -$330 | -0.057% |
| 30 Days | -$1,942 | -0.332% |
| 3 Months | -$2,554 | -0.436% |
| 6 Months | +$9,810 | +1.71% |
| 1 Year | -$29.2k | -4.76% |
| 3 Years | +$96.7k | +19.9% |
| 5 Years | +$152k | +35.3% |
| 10 Years | +$299k | +105% |
List My Property
Real Estate Statistics
Financing Solutions
AS SEEN ON


Are You a Licensed Real Estate Agent or Broker?