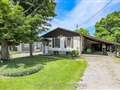
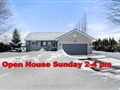
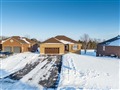
67 Nonquon Dr
$802,502
Comparative Market Analysis
Jul 2, 2025
NOT AN ACTIVE LISTING
Historical Performance
| Period | $ Change | % Change |
| 1 Day | +$53 | +0.007% |
| 7 Days | -$388 | -0.048% |
| 30 Days | -$2,289 | -0.284% |
| 3 Months | -$1,745 | -0.217% |
| 6 Months | +$18.3k | +2.33% |
| 1 Year | -$31.5k | -3.78% |
| 3 Years | +$130k | +19.3% |
| 5 Years | +$202k | +33.6% |
| 10 Years | +$406k | +103% |
List My Property
Real Estate Statistics
Financing Solutions
AS SEEN ON


Are You a Licensed Real Estate Agent or Broker?