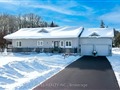
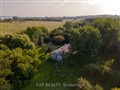
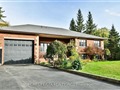
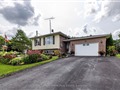
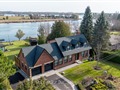
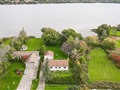
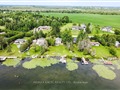
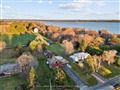
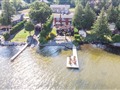
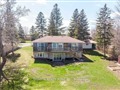
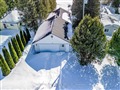
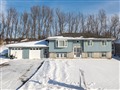
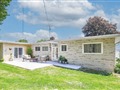
57 Shelley Dr
$594,008
Comparative Market Analysis
Apr 2, 2025
NOT AN ACTIVE LISTING
Historical Performance
| Period | $ Change | % Change |
| 1 Day | +$40 | +0.007% |
| 7 Days | -$355 | -0.060% |
| 30 Days | -$2,074 | -0.348% |
| 3 Months | -$2,931 | -0.491% |
| 6 Months | +$9,259 | +1.58% |
| 1 Year | -$31.6k | -5.06% |
| 3 Years | +$91.7k | +18.3% |
| 5 Years | +$148k | +33.2% |
| 10 Years | +$301k | +103% |
List My Property
Real Estate Statistics
Financing Solutions
Browsing History
90 Northline Rd, Kawartha Lakes
2 seconds ago
422 Northline Rd, Kawartha Lakes
3 seconds ago
89 Queen St, Kawartha Lakes
4 seconds ago
41 North Taylor Rd, Kawartha Lakes
5 seconds ago
823 County Rd 121 Rd, Kawartha Lakes
6 seconds ago
23 Shelley Dr, Kawartha Lakes
7 seconds ago
45 Shelley Dr, Kawartha Lakes
8 seconds ago
27 North Taylor Rd, Kawartha Lakes
9 seconds ago
91 Queen St, Kawartha Lakes
10 seconds ago
AS SEEN ON


Are You a Licensed Real Estate Agent or Broker?