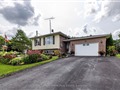
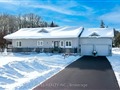
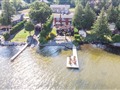
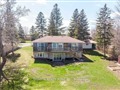
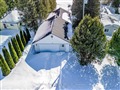
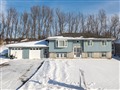
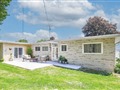
52 Shelley Dr
$671,944
Comparative Market Analysis
Apr 2, 2025
NOT AN ACTIVE LISTING
Historical Performance
| Period | $ Change | % Change |
| 1 Day | +$45 | +0.007% |
| 7 Days | -$386 | -0.057% |
| 30 Days | -$2,265 | -0.336% |
| 3 Months | -$3,051 | -0.452% |
| 6 Months | +$11.0k | +1.67% |
| 1 Year | -$34.5k | -4.88% |
| 3 Years | +$108k | +19.2% |
| 5 Years | +$175k | +35.3% |
| 10 Years | +$316k | +88.9% |
List My Property
Real Estate Statistics
Financing Solutions
Browsing History
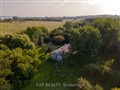
41 Antiquary Beach Rd, Kawartha Lakes
0 second ago
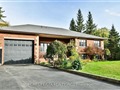
83 Antiquary Beach Rd, Kawartha Lakes
0 second ago
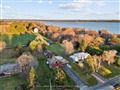
2160 Highway 2, Clarington
17 seconds ago
4518 Highway 2, Clarington
18 seconds ago
1989 Highway 2, Clarington
19 seconds ago
AS SEEN ON


Are You a Licensed Real Estate Agent or Broker?