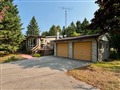
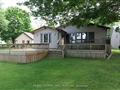
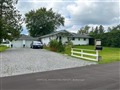
43 Pinewood Blvd
$1,116,769
Comparative Market Analysis
Jul 4, 2025
NOT AN ACTIVE LISTING
Historical Performance
| Period | $ Change | % Change |
| 1 Day | +$74 | +0.007% |
| 7 Days | +$3,466 | +0.311% |
| 30 Days | +$20.1k | +1.83% |
| 3 Months | +$103k | +10.2% |
| 6 Months | +$272k | +32.2% |
| 1 Year | +$269k | +31.8% |
| 3 Years | +$433k | +63.4% |
| 5 Years | +$507k | +83.1% |
| 10 Years | +$714k | +178% |
List My Property
Real Estate Statistics
Financing Solutions
AS SEEN ON


Are You a Licensed Real Estate Agent or Broker?