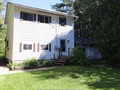
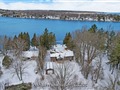
4 John St
$515,145
Comparative Market Analysis
Jul 3, 2025
NOT AN ACTIVE LISTING
Historical Performance
| Period | $ Change | % Change |
| 1 Day | +$34 | +0.007% |
| 7 Days | -$54 | -0.011% |
| 30 Days | -$518 | -0.100% |
| 3 Months | +$1,919 | +0.374% |
| 6 Months | +$18.1k | +3.65% |
| 1 Year | -$354 | -0.069% |
| 3 Years | +$160k | +45.0% |
| 5 Years | +$198k | +62.3% |
| 10 Years | +$297k | +136% |
List My Property
Real Estate Statistics
Financing Solutions
Browsing History
13 John St, Kawartha Lakes
6 seconds ago
114 Robmar Cres, Kawartha Lakes
10 seconds ago
AS SEEN ON


Are You a Licensed Real Estate Agent or Broker?