($title)
($content)
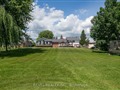
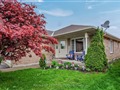
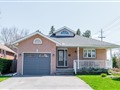
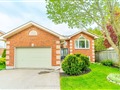
39 St. Paul St
$331,343
Comparative Market Analysis
May 19, 2024
NOT AN ACTIVE LISTING
Historical Performance
| Period | $ Change | % Change |
| 1 Day | +$22 | +0.007% |
| 7 Days | -$138 | -0.042% |
| 30 Days | -$860 | -0.259% |
| 3 Months | -$668 | -0.201% |
| 6 Months | +$7,169 | +2.21% |
| 1 Year | -$13.0k | -3.76% |
| 3 Years | +$66.8k | +25.3% |
| 5 Years | +$111k | +50.3% |
| 10 Years | +$200k | +151% |
List My Property
Request Sold History
Real Estate Statistics
Financing Solutions
AS SEEN ON

FOR SALE
FOR RENT
LIST PROPERTY FOR SALE
Property Type
Barrie 714
Brampton 1.51k
Burlington 461
Hamilton 1.46k
Kawartha Lakes 596
Bobcaygeon 59
Lindsay 134
see all
Kitchener 377
London 715
Markham 709
Mississauga 1.71k
Oakville 758
Oshawa 473
Richmond Hill 723
Toronto 8.47k
Vaughan 1.01k
Bedrooms
Bathrooms
Search Listings
Save Graph
How is this Graph Generated?
GRAPH AND COMPARATIVE MARKET ANALYSIS (CMA) METHODOLOGY
The CMA graph for 39 St. Paul St is based on Kawartha Lakes 365-day running median for 5-bedroom, 3-bathroom
duplex property properties and adjusted for sold comparables in the area. This CMA does not reflect recent home improvements that may have been done to this property.
The CMA represents a seasonally adjusted long term valuation trends and may not immediately reflect short term market fluctuations. If you are interested in raw
monthly real estate market statistics and short term market fluctuations, please refer to
real estate statistics for Kawartha Lakes.
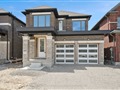
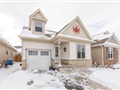
SIMILAR PROPERTIES FOR SALE
Welcome to lakefront luxury living at its finest! This stunning Lake Scugog home boasts 100 feet of waterfront, offering unparalleled views and...
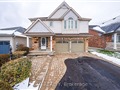
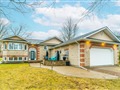
Welcome to 54 Ellis Crescent, a charming family home nestled in the heart of Lindsay, ON. Located in a serene and welcoming community, this...
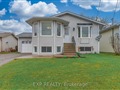
STUNNING EXECUTIVE HOME IN LINDSAY!! This Spacious And Bright "Corner Lot" Home Boasts Many Upgrades And Generous Square Footage And High Ceilings...
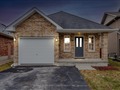
Lovely & Cozy 3 Bedrooms 2 Storey Detached Home. Quality Built By Mason Homes "Snowdon Model" Close to1600 Sq Ft; Very Bright Unit WithLarge Foyer...
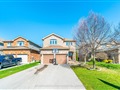
Welcome to 25 Corley St in Lindsay's Sugarwood Community! This Brand-New, Never Lived in, all Brick & Stone home offers an amazing open concept...
This Stunning 2 Story Home Beautifully Combines Functionality & Style, Featuring 3 Spacious Bdrms & 4 Baths. As You Enter, You Are Greeted By A Warm...
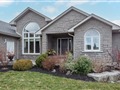
This 1932 sq ft three bedroom two bath brick bungalow sits on one of Lindsay's most sought after streets. Inside features a fantastic floor plan...
Beautiful Walkout Detached Property with 3 Bedrooms & 4 Bathroom on a Ravine Lot available for sale. Finished Walkout Basement with 1 Bedroom and den...
This Charming, Open Concept Bungaloft Is Just 7 Years New And Features 2 Bed And 3 Bath and Single Car Garage. The Primary Bedroom Has A Generous...
Welcome home to this stunning brick 2+1 bedrm 3 bath bungalow offering space & versatility. Updated kitchen/dining rm combo is a chef's delight with...
This fantastic modern family home is move in ready! Close to all amenities in the vibrant village of Bobcaygeon including, shops, restaurants, bars...
Welcome to this spacious 2+2 bedroom, THREE bathroom bungalow centrally located in the heart of Lindsay! This charming home offers convenient access...
Located in one of the best neighbourhoods Lindsay has to offer! This 2 bedroom brick bungalow features an in-law suite with separate entrance and is...
Come home to 1 Langton Place! This comfortable 2 plus 2 bedroom, 2 bathroom brick bungalow offers a perfect blend of style, functionality, and...
Welcome to a spacious 2+2 bedrm 2 bath bungalow located in Lindsays North Ward. Boasting a host of appealing features, this property offers...
5
BEDROOMS
3
BATHROOMS
2
KITCHENS
ADDRESS
PROPERTY TYPE
Duplex Property
LOT SIZE66.00 x 132.00
STATUSNOT AN ACTIVE LISTING
COMPARATIVE MARKET ANALYSIS
$331,343
Refinance Your Property
Comparative Market Analysis of 39 St. Paul St is based on market trends for Lindsay community of Kawartha Lakes community and recent sales in the area.
The sold statistics information is provided by Toronto Real Estate Board (Reference: Competition Bureau vs. TREB in Federal Court of Appeal - 27 April, 2016;
TREB's appeal was dismissed and it is now mandated to provide sold data to the public).
Comparative Market Analysis is provided for reference purposes only and may be
different from the actual market sold price or an appraised value. Comparative Market Analysis does not take into account recent home improvements that have been
carried out to the property. Listing.ca does not bare any responsibility to the accuracy of the provided opinion. The graph represents a seasonally
adjusted long term valuation trends and may not immediately reflect short term market fluctuations.
SALES HISTORY
SOLD COMPARABLES
MARKET STATS
XX/XX/20XX
SOLD
$XXX,500
XX/XX/20XX
SOLD
$XXX,000
Request Sold History
5+1 Beds
4 Baths
Sold Price
$778,000
List Price
$779,900
Sold Date
09/08/2023
DOM
XX Days
5 Beds
2 Baths
Sold Price
$445,000
List Price
$449,999
Sold Date
06/13/2023
DOM
XX Days
5 Beds
4 Baths
Sold Price
$940,000
List Price
$949,900
Sold Date
06/09/2023
DOM
XX Days
5 Beds
4 Baths
Sold Price
$940,000
List Price
$949,900
Sold Date
06/09/2023
DOM
XX Days
4 Beds
3 Baths
Sold Price
$725,000
List Price
$749,900
Sold Date
02/16/2024
DOM
XX Days
Request All 271 Sold Comparables
PROPERTY DESCRIPTION
39 St. Paul St is a 5-bedroom 3-washroom duplex property located in Lindsay community of Kawartha Lakes. It is currently NOT FOR SALE, but is
worth in our opinion around $331,343
.
The property is situated on a 66' frontage by 132' deep lot. 39 St. Paul St is currently not for sale and is not an active listing on Listing.ca.
NEARBY GROCERY STORES
The property is situated on a 66' frontage by 132' deep lot. 39 St. Paul St is currently not for sale and is not an active listing on Listing.ca.
Food Basics 1.7 km
363 Kent St W, K9V2Z7
Phone: (705) 878-3300 Foodland 17.5 km
1043 Little Britain Rd RR 3, K0M2C0
Phone: (705) 786-2300 Foodland 63.8 km
12325 Hwy 35 RR 3, K0M2K0
Phone: (705) 286-1121 Foodland 15.3 km
31 King St E, K0L2W0
Phone: (705) 799-5211 Foodland 31.8 km
62 Bolton, K0M1A0
Phone: (705) 738-2282 Open Grocery 0.4 km
106 Queen St, K9V1G6
Phone: (705) 324-3995 Pontypool Country Market 31.8 km
62 Bolton, K0M1A0
Phone: (705) 277-2178 Sobeys 19.7 km
15 Lindsay St, K0M1N0
Phone: (705) 887-3611 Strang's Valu-Mart 31.8 km
101 East St S RR 2, K0M1A0
Phone: (705) 738-6651 Valu-Mart 63.8 km
12646 35 Hwy, K0M2K0
Phone: (705) 286-6032 Woodville Food Market 33.2 km
99 King, K0M2T0
Phone: (705) 439-2471
Are You a Licensed Real Estate Agent or Broker?
© 2011-2024 Real Estate Bay Realty Inc, Brokerage
The information provided herein must only be used by consumers that have a bona fide interest in the purchase, sale, or lease of real estate and may not be used for any commercial or any other purpose. Information is deemed reliable but is not guaranteed accurate by TREB, Listing.ca or Real Estate Bay Realty, Brokerage.
The trademarks MLS®, Multiple Listing Service® and the associated logos are owned by The Canadian Real Estate Association (CREA) and identify the quality of services provided by real estate professionals who are members of CREA. Used under license.
Real Estate Bay Realty, Brokerage
220 Duncan Mill Road, Suite 209
Toronto, ON M3B 3J5
Phone: 416-800-1055
info@listing.ca Listing.ca on Twitter
RealEstateBay.ca on Facebook
220 Duncan Mill Road, Suite 209
Toronto, ON M3B 3J5
Phone: 416-800-1055
info@listing.ca Listing.ca on Twitter
RealEstateBay.ca on Facebook