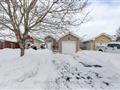
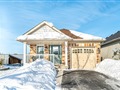
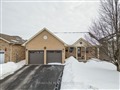
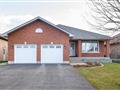
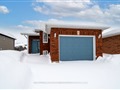
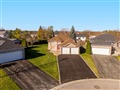
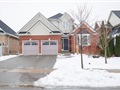
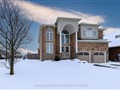
33 Mcgibbon Blvd
$596,025
Comparative Market Analysis
Jun 8, 2025
NOT AN ACTIVE LISTING
Historical Performance
| Period | $ Change | % Change |
| 1 Day | +$40 | +0.007% |
| 7 Days | -$318 | -0.053% |
| 30 Days | -$1,894 | -0.317% |
| 3 Months | -$2,338 | -0.391% |
| 6 Months | +$10.5k | +1.80% |
| 1 Year | -$28.9k | -4.63% |
| 3 Years | +$101k | +20.4% |
| 5 Years | +$165k | +38.1% |
| 10 Years | +$329k | +123% |
List My Property
Real Estate Statistics
Financing Solutions
AS SEEN ON


Are You a Licensed Real Estate Agent or Broker?