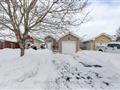
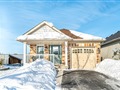
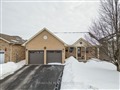
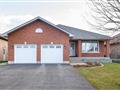
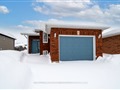
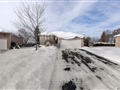
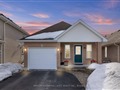
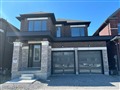
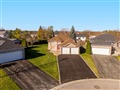
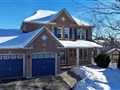
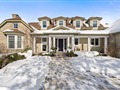
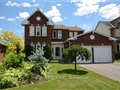
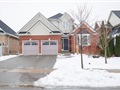
31 Mcgibbon Blvd
$576,222
Comparative Market Analysis
Jun 8, 2025
NOT AN ACTIVE LISTING
Historical Performance
| Period | $ Change | % Change |
| 1 Day | +$38 | +0.007% |
| 7 Days | -$249 | -0.043% |
| 30 Days | -$1,536 | -0.266% |
| 3 Months | -$1,255 | -0.217% |
| 6 Months | +$12.4k | +2.20% |
| 1 Year | -$22.3k | -3.72% |
| 3 Years | +$119k | +26.1% |
| 5 Years | +$190k | +49.1% |
| 10 Years | +$324k | +129% |
List My Property
Real Estate Statistics
Financing Solutions
AS SEEN ON

Are You a Licensed Real Estate Agent or Broker?