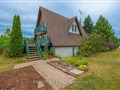
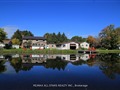
23 Jubbs Shore Rd
$842,522
Comparative Market Analysis
Jul 3, 2025
NOT AN ACTIVE LISTING
Historical Performance
| Period | $ Change | % Change |
| 1 Day | +$56 | +0.007% |
| 7 Days | -$117 | -0.014% |
| 30 Days | -$1,036 | -0.123% |
| 3 Months | +$2,112 | +0.251% |
| 6 Months | +$26.3k | +3.22% |
| 1 Year | -$13.2k | -1.54% |
| 3 Years | +$241k | +40.0% |
| 5 Years | +$401k | +90.6% |
| 10 Years | +$528k | +168% |
List My Property
Real Estate Statistics
Financing Solutions
AS SEEN ON


Are You a Licensed Real Estate Agent or Broker?