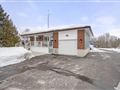
23 Janet Dr
$744,530
Comparative Market Analysis
Jul 1, 2025
NOT AN ACTIVE LISTING
Historical Performance
| Period | $ Change | % Change |
| 1 Day | +$50 | +0.007% |
| 7 Days | -$285 | -0.038% |
| 30 Days | -$1,805 | -0.242% |
| 3 Months | -$1,013 | -0.136% |
| 6 Months | +$17.3k | +2.38% |
| 1 Year | -$25.3k | -3.29% |
| 3 Years | +$167k | +28.8% |
| 5 Years | +$261k | +53.8% |
| 10 Years | +$490k | +192% |
List My Property
Real Estate Statistics
Financing Solutions
AS SEEN ON


Are You a Licensed Real Estate Agent or Broker?