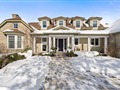
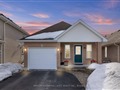
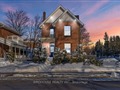
22 Milner Crt
$669,981
Comparative Market Analysis
Apr 4, 2025
NOT AN ACTIVE LISTING
Historical Performance
| Period | $ Change | % Change |
| 1 Day | +$45 | +0.007% |
| 7 Days | -$293 | -0.044% |
| 30 Days | -$1,808 | -0.269% |
| 3 Months | -$1,569 | -0.234% |
| 6 Months | +$14.1k | +2.14% |
| 1 Year | -$27.1k | -3.89% |
| 3 Years | +$132k | +24.6% |
| 5 Years | +$219k | +48.5% |
| 10 Years | +$397k | +145% |
List My Property
Real Estate Statistics
Financing Solutions
Browsing History
15 Springbank Rd, Kawartha Lakes
2 seconds ago
636 Frankhill Rd, Kawartha Lakes
3 seconds ago
AS SEEN ON

Are You a Licensed Real Estate Agent or Broker?