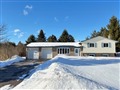
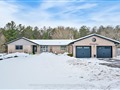
213 John St
$488,609
Comparative Market Analysis
Jul 3, 2025
NOT AN ACTIVE LISTING
Historical Performance
| Period | $ Change | % Change |
| 1 Day | +$33 | +0.007% |
| 7 Days | -$203 | -0.041% |
| 30 Days | -$1,259 | -0.257% |
| 3 Months | -$903 | -0.184% |
| 6 Months | +$10.9k | +2.28% |
| 1 Year | -$17.7k | -3.50% |
| 3 Years | +$105k | +27.4% |
| 5 Years | +$161k | +49.1% |
| 10 Years | +$272k | +126% |
List My Property
Real Estate Statistics
Financing Solutions
Browsing History
4 Avalon Dr, Kawartha Lakes
6 seconds ago
146 Robmar Cres, Kawartha Lakes
9 seconds ago
AS SEEN ON

Are You a Licensed Real Estate Agent or Broker?