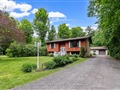
20 John St
$516,219
Comparative Market Analysis
Jul 3, 2025
NOT AN ACTIVE LISTING
Historical Performance
| Period | $ Change | % Change |
| 1 Day | +$34 | +0.007% |
| 7 Days | -$248 | -0.048% |
| 30 Days | -$1,502 | -0.290% |
| 3 Months | -$1,558 | -0.301% |
| 6 Months | +$10.1k | +2.00% |
| 1 Year | -$22.5k | -4.18% |
| 3 Years | +$97.1k | +23.2% |
| 5 Years | +$159k | +44.4% |
| 10 Years | +$289k | +127% |
List My Property
Real Estate Statistics
Financing Solutions
Browsing History
75 Robmar Cres, Kawartha Lakes
3 seconds ago
AS SEEN ON


Are You a Licensed Real Estate Agent or Broker?