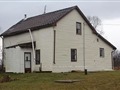
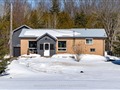
17 John St
$443,163
Comparative Market Analysis
Jul 3, 2025
NOT AN ACTIVE LISTING
Historical Performance
| Period | $ Change | % Change |
| 1 Day | +$29 | +0.007% |
| 7 Days | +$9 | +0.002% |
| 30 Days | -$176 | -0.040% |
| 3 Months | +$2,515 | +0.571% |
| 6 Months | +$17.4k | +4.08% |
| 1 Year | +$3,713 | +0.845% |
| 3 Years | +$159k | +56.0% |
| 5 Years | +$204k | +85.5% |
| 10 Years | +$286k | +181% |
List My Property
Real Estate Statistics
Financing Solutions
Browsing History
Walmac Shores Rd, Kawartha Lakes
6 seconds ago
147 Robmar Cres, Kawartha Lakes
11 seconds ago
5248 Main St, Clarington
16 seconds ago
AS SEEN ON


Are You a Licensed Real Estate Agent or Broker?