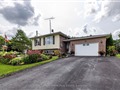
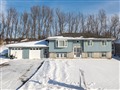
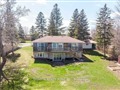
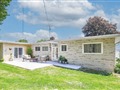
16 Shelley Dr
$491,965
Comparative Market Analysis
Apr 5, 2025
NOT AN ACTIVE LISTING
Historical Performance
| Period | $ Change | % Change |
| 1 Day | +$33 | +0.007% |
| 7 Days | -$252 | -0.051% |
| 30 Days | -$1,509 | -0.306% |
| 3 Months | -$1,751 | -0.355% |
| 6 Months | +$9,054 | +1.87% |
| 1 Year | -$23.0k | -4.47% |
| 3 Years | +$86.0k | +21.2% |
| 5 Years | +$141k | +40.2% |
| 10 Years | +$278k | +130% |
List My Property
Real Estate Statistics
Financing Solutions
AS SEEN ON


Are You a Licensed Real Estate Agent or Broker?