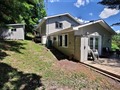
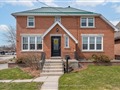
13 John St
$468,294
Comparative Market Analysis
Jul 3, 2025
NOT AN ACTIVE LISTING
Historical Performance
| Period | $ Change | % Change |
| 1 Day | +$31 | +0.007% |
| 7 Days | -$159 | -0.034% |
| 30 Days | -$1,040 | -0.222% |
| 3 Months | -$349 | -0.074% |
| 6 Months | +$11.4k | +2.50% |
| 1 Year | -$15.0k | -3.10% |
| 3 Years | +$107k | +29.7% |
| 5 Years | +$176k | +60.4% |
| 10 Years | +$289k | +162% |
List My Property
Real Estate Statistics
Financing Solutions
Browsing History
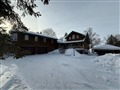
114 Robmar Cres, Kawartha Lakes
5 seconds ago
AS SEEN ON


Are You a Licensed Real Estate Agent or Broker?