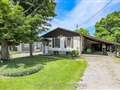
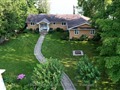
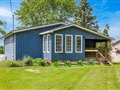
116 Gilson St
$1,103,983
Comparative Market Analysis
Apr 10, 2025
NOT AN ACTIVE LISTING
Historical Performance
| Period | $ Change | % Change |
| 1 Day | +$73 | +0.007% |
| 7 Days | -$1,852 | -0.167% |
| 30 Days | -$9,894 | -0.888% |
| 3 Months | -$26.7k | -2.36% |
| 6 Months | -$31.8k | -2.80% |
| 1 Year | -$192k | -14.8% |
| 3 Years | -$164k | -12.9% |
| 5 Years | -$28.3k | -2.50% |
| 10 Years | +$357k | +47.8% |
List My Property
Real Estate Statistics
Financing Solutions
AS SEEN ON


Are You a Licensed Real Estate Agent or Broker?