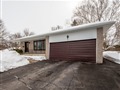
11 Oak St
$655,334
Comparative Market Analysis
Jun 30, 2025
NOT AN ACTIVE LISTING
Historical Performance
| Period | $ Change | % Change |
| 1 Day | +$44 | +0.007% |
| 7 Days | -$156 | -0.024% |
| 30 Days | -$1,095 | -0.167% |
| 3 Months | +$940 | +0.144% |
| 6 Months | +$19.7k | +3.10% |
| 1 Year | -$9,293 | -1.40% |
| 3 Years | +$175k | +36.4% |
| 5 Years | +$227k | +53.1% |
| 10 Years | +$373k | +132% |
List My Property
Real Estate Statistics
Financing Solutions
Browsing History
22 Flavelle Cres, Kawartha Lakes
6 seconds ago
160 Elgin St, Kawartha Lakes
11 seconds ago
94 Elgin St, Kawartha Lakes
16 seconds ago
94 Mcfeeters Cres, Clarington
21 seconds ago
26 Poolton Cres, Clarington
25 seconds ago
AS SEEN ON

Are You a Licensed Real Estate Agent or Broker?