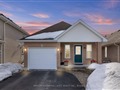
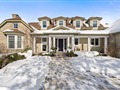
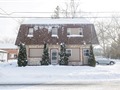
11 Dyana Dr
$540,272
Comparative Market Analysis
Jun 30, 2025
NOT AN ACTIVE LISTING
Historical Performance
| Period | $ Change | % Change |
| 1 Day | +$36 | +0.007% |
| 7 Days | -$190 | -0.035% |
| 30 Days | -$1,222 | -0.226% |
| 3 Months | -$407 | -0.075% |
| 6 Months | +$13.4k | +2.54% |
| 1 Year | -$16.0k | -2.88% |
| 3 Years | +$128k | +31.0% |
| 5 Years | +$186k | +52.7% |
| 10 Years | +$307k | +131% |
List My Property
Real Estate Statistics
Financing Solutions
Browsing History
12 Margaret Ave, Kawartha Lakes
2 seconds ago
62 Northlin Park Rd, Kawartha Lakes
3 seconds ago
1 Rosemeadow Cres, Clarington
4 seconds ago
50 Inglis Ave, Clarington
4 seconds ago
AS SEEN ON

Are You a Licensed Real Estate Agent or Broker?