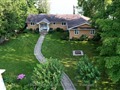
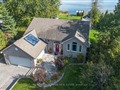
11 Druan Dr
$1,481,889
Comparative Market Analysis
Jul 3, 2025
NOT AN ACTIVE LISTING
Historical Performance
| Period | $ Change | % Change |
| 1 Day | +$99 | +0.007% |
| 7 Days | +$43 | +0.003% |
| 30 Days | -$591 | -0.040% |
| 3 Months | +$7,768 | +0.527% |
| 6 Months | +$54.8k | +3.84% |
| 1 Year | -$2,615 | -0.176% |
| 3 Years | +$496k | +50.3% |
| 5 Years | +$828k | +127% |
| 10 Years | +$1.16m | +361% |
List My Property
Real Estate Statistics
Financing Solutions
Browsing History
72 Druan Dr, Kawartha Lakes
5 seconds ago
10 Simnick Cres, Clarington
10 seconds ago
159 Cornish Dr, Clarington
14 seconds ago
AS SEEN ON


Are You a Licensed Real Estate Agent or Broker?