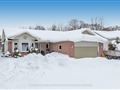
109 John St
$514,255
Comparative Market Analysis
Jul 3, 2025
NOT AN ACTIVE LISTING
Historical Performance
| Period | $ Change | % Change |
| 1 Day | +$34 | +0.007% |
| 7 Days | -$179 | -0.035% |
| 30 Days | -$1,153 | -0.224% |
| 3 Months | -$337 | -0.066% |
| 6 Months | +$12.9k | +2.57% |
| 1 Year | -$14.7k | -2.78% |
| 3 Years | +$122k | +31.2% |
| 5 Years | +$173k | +50.9% |
| 10 Years | +$289k | +129% |
List My Property
Real Estate Statistics
Financing Solutions
Browsing History
165 Mcgill Dr, Kawartha Lakes
6 seconds ago
10 Ellard Crt, Kawartha Lakes
11 seconds ago
14 Beach Rd, Kawartha Lakes
12 seconds ago
AS SEEN ON


Are You a Licensed Real Estate Agent or Broker?