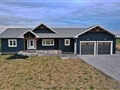
100 John St
$484,467
Comparative Market Analysis
Jul 3, 2025
NOT AN ACTIVE LISTING
Historical Performance
| Period | $ Change | % Change |
| 1 Day | +$32 | +0.007% |
| 7 Days | -$105 | -0.022% |
| 30 Days | -$779 | -0.160% |
| 3 Months | +$645 | +0.133% |
| 6 Months | +$14.0k | +2.98% |
| 1 Year | -$9,851 | -1.99% |
| 3 Years | +$132k | +37.4% |
| 5 Years | +$211k | +76.9% |
| 10 Years | +$273k | +129% |
List My Property
Real Estate Statistics
Financing Solutions
Browsing History
Fire Route #114 Rte, Kawartha Lakes
5 seconds ago
89 Robmar Cres, Kawartha Lakes
10 seconds ago
Dunn St, Kawartha Lakes
15 seconds ago
AS SEEN ON


Are You a Licensed Real Estate Agent or Broker?