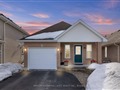
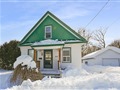
1 Marsh Crt
$553,178
Comparative Market Analysis
Jun 30, 2025
NOT AN ACTIVE LISTING
Historical Performance
| Period | $ Change | % Change |
| 1 Day | +$37 | +0.007% |
| 7 Days | -$215 | -0.039% |
| 30 Days | -$1,345 | -0.242% |
| 3 Months | -$684 | -0.123% |
| 6 Months | +$13.3k | +2.46% |
| 1 Year | -$17.0k | -2.99% |
| 3 Years | +$123k | +28.5% |
| 5 Years | +$209k | +60.6% |
| 10 Years | +$310k | +127% |
List My Property
Real Estate Statistics
Financing Solutions
AS SEEN ON


Are You a Licensed Real Estate Agent or Broker?